
Return on Investment and Decision Support in Industrial Manufacturing
Németh Balázs ·
This article examines when and why automation pays off in an industrial environment – with particular regard to economic return, ROI calculations and decision-support considerations. It highlights that automation is not only about cutting costs, but a strategic step towards competitive, crisis-resilient and sustainable industrial operations in the long term. Estimated reading time: 8 minutes.
Factors driving automation
Industrial automation has by now become one of the most influential forces transforming manufacturing and production processes. It enables companies to increase productivity, reduce operating costs and improve quality. Companies typically decide in favour of industrial automation for four kinds of reasons (although other considerations may also apply):
- A working environment that is inadequate in terms of ergonomics and occupational safety: For example, if a worker has to lift 30 kg parts for 8 hours a day, this is unacceptable not only from a health perspective but also from a legal one. In this case automation is not a choice, but a necessity.
- Labour shortage or excessively high wage costs: Particularly in Western Hungary and the Budapest area, manufacturing companies often cannot find enough trainable operators. In this situation automation is not only economical, but also the key to keeping production sustainable.
- Persistent quality problems: Errors arising from manual work cause scrap, rework and complaints. The scrap rate is easy to express in monetary terms, but the loss of prestige and the erosion of customer trust are far harder to repair. Automation delivers more consistent, more error-free quality.
- It is simply cheaper to do it with a machine: The total acquisition and operating cost of a special-purpose machine or robot is in many cases lower than the annual cost of the operator work it replaces.
How much does automation cost?
This is the first question raised in connection with almost every industrial automation project. Although it is understandable that the investment cost immediately comes into focus, this approach can be misleading on its own. Automation should be understood not as a one-off expense, but as a long-term investment. At the same time, it is an entirely legitimate demand on the part of decision-makers that investments should also be economically justifiable. Calculating the return on automation is not a random estimate, but an objective, financially grounded decision-support tool. The most commonly used metric is ROI (Return on Investment), which can be calculated using the following formula:
ROI = (Benefit − Investment) / Investment * 100
The formula shows the ratio of the benefit generated by the investment to the capital invested. Naturally, a positive number means that the investment has paid for itself, and a negative one that it has not yet done so.
Let us look at a simple example in which an automated cell costs EUR 120,000 and replaces 1 operator in continuous operation (4 shifts), while the annual wage cost of an operator is EUR 18,000. The automated cell is expected to operate for 5 years. This is what the calculation looks like in this case:
| Benefit (wages that no longer have to be paid, 1 operator – 4 shifts): | 18,000 x 4 = EUR 72,000 |
| Investment (the investment value of the equipment): | EUR 120,000 |
| End of year 1: | (72,000 − 120,000) / 120,000 * 100 = −40% |
Not paid back within one year |
| End of year 2: | (144,000 − 120,000) / 120,000 * 100 = 20% |
The profit is 20% of the amount invested |
| End of year 3: | (216,000 − 120,000) / 120,000 * 100 = 80% |
The profit is 80% of the amount invested |
| End of year 4: | (288,000 − 120,000) / 120,000 * 100 = 140% |
The profit is 140% of the amount invested |
| End of year 5: | (360,000 − 120,000) / 120,000 * 100 = 200% |
The profit is 200% of the amount invested |
By rearranging the formula, we can calculate how long it takes for the investment to pay for itself:
Payback period (years) = Investment / Annual benefit
120,000 / 72,000 = 1.66 years
The formula shows that ROI can be determined well if its two variables – the benefit and the investment – can be determined or estimated accurately. Both variables have elements that are easy to express in monetary terms and elements that are less so, and both also change over time; this is what makes this simple formula difficult to use.
A note for financial managers
The return calculations in this article were not prepared on a discounted cash-flow basis. For large-volume or long-term (>5 years) investments, it may be justified to take the time value of money into account (NPV, IRR). For the pre-screening of automation projects, however, non-discounted ROI is often a quick and easily interpretable decision-support tool.
Which factors influence the return?
The economic assessment of an industrial automation investment is never merely a question of buying a machine. The real return is determined by a range of interrelated financial, operational and strategic factors. Below we go through the elements that influence ROI, grouped into two main categories: investment and benefit.
| Investment | Benefit |
|---|---|
| Initial investment costs | Labour savings |
| Maintenance costs | Taking wage growth trends into account |
| Wage requirements of technician staff | Increased efficiency |
| Quality improvement | |
| Optimised energy and material consumption | |
| Scalability and flexibility | |
| Operational reliability and crisis resilience |
1. Initial investment costs
The primary cost elements of automation include the purchase of the automated cells – industrial robots, special-purpose machines, sensors, control systems – as well as the costs of installation, integration, software licences and training. It must also be taken into account that production may temporarily decrease during the introduction period, which can mean a further transitional loss.
2. Maintenance costs
Maintaining automated solutions is not just a one-off investment. During operation, continuous preventive and corrective maintenance work is required: software updates, lubrication, replacement of sensors and parts, firmware costs. For some more complex systems, the annual maintenance cost can reach 5–10% of the asset value. It is important to note that these costs are regular and can be calculated well – yet they are often left out of the initial ROI calculation.
3. Cost of technician staff
Automated solutions are not fully autonomous. The former operators are replaced by technicians and maintenance staff, who work at a higher wage level but can supervise several machines at the same time. The unit cost is therefore often still more favourable, but more highly qualified personnel must be provided compared with the workforce replaced.
4. Labour savings and wage growth trends
The most significant saving results from the reduction in labour costs. A well-implemented automation project can replace several operators, which can yield savings of several million forints a year. In 2025, the annual wage cost of a production-line operator in Hungary ranges between HUF 3.2 and 6.7 million. This effect is particularly noticeable in three- or four-shift operation, where the same task is performed by several people in rotation.
The effect is further reinforced by the fact that wage costs are rising steadily. In Hungary, industrial wages typically grow by 6–10% a year, so an investment that only partly pays off today may become highly profitable within a few years. According to Eurostat's 2025 data, the average labour cost in Hungary is EUR 14.1 per hour, which exceeds the level of Bulgaria (EUR 10.6 per hour) and Romania (EUR 12.5 per hour) and places the country among the front-runners of the Central and Eastern European region. At the same time, the gap to the European Union average (EUR 33.5 per hour) is still considerable, especially compared with Germany, where this figure reaches EUR 43 per hour. So although Hungary's labour costs are still far from the Western European level, within the region the country no longer counts as particularly cheap, which makes automation a question of competitiveness.
5. Increased efficiency
Robots and automated equipment can operate continuously – there are no breaks, no sick leave and no fatigue. While an operator spends a net 7–7.5 hours or so of an eight-hour shift on active work (breaks, shift start-up), an automated cell can produce for up to 8 hours in the same period. On a monthly basis this can mean 20–30 hours of extra capacity per machine, which is a significant increase in terms of production volume and yield.
6. Quality improvement
Machines work with constant accuracy and precision. Thanks to sensors, machine vision systems and continuous feedback, repeatability is higher and the error rate lower. This means less scrap, less material loss and lower follow-up costs arising from defects.
7. Optimised energy and material consumption
Robotic solutions are able to optimise consumption: they use only the necessary amount of energy, pressure and material, and automatically switch to stand-by mode when the machine is stopped. This results in a measurable cost reduction during operation.
8. Scalability and flexibility
A robotic solution can be expanded on a modular basis – new robot cells and machine units can be integrated without having to increase human resources proportionally. This makes it possible to respond quickly to market expansion or new orders without having to reckon with labour shortages or recruitment risks.
9. Operational reliability and crisis resilience
The COVID period clearly showed that production built on human labour is vulnerable: infections, quarantine and absences can all bring production to a halt. By contrast, an automated production line can operate with a team of as few as 5–10 technicians and is less dependent on labour market instability. This stability is difficult to quantify, but it represents a strategic advantage.
How long does it take for automation to pay for itself?
The payback period of industrial automation depends to a large extent on the nature of the industry, the complexity of the technology, the stability of production volumes, and on which costs it replaces and how much efficiency it gains.
According to professional experience, most automation investments pay for themselves within a period of between 6 months and 5 years. Simpler systems, such as pick-and-place robots or automatic inspection devices, typically recoup the investment in between 6 months and 2 years. For more complex special-purpose machines or complete production lines, the payback period tends to be 2–5 years. For strategic, large-scale developments – such as systems controlled by artificial intelligence or smart factories – the payback period may exceed 5 years, but these investments can deliver a significant competitive advantage.
The payback period is closely related to the product cycle of the given industry, i.e. how often the manufactured product changes and how long a given production line can operate without major modification. Where the manufacturing environment and the product structure are stable in the long term, automation typically pays off better.
| Industry | Typical payback period | Typical product cycle |
|---|---|---|
| Automotive | 1.5–3 years | 4–6 years |
| Electronics manufacturing | 1–3 years | 1–3 years |
| Food and beverage | 3–5+ years | 10–20 years |
| Paper and wood | 3–5 years | 3–6 years |
| Pharmaceuticals | 2–4+ years | 5–10 years |
| Chemicals and chemical products | 2–5 years | 5–8 years |
| Energy, packaging | 5–7+ years | 10–20 years |
Case study – Automating a grinding and visual inspection process
The following case study presents a simple but well-documented automation project of ours, implemented in 2018, in which we were able to follow the entire life cycle of the automation. We chose this example because it is easy to follow and the results of the investment can be quantified.
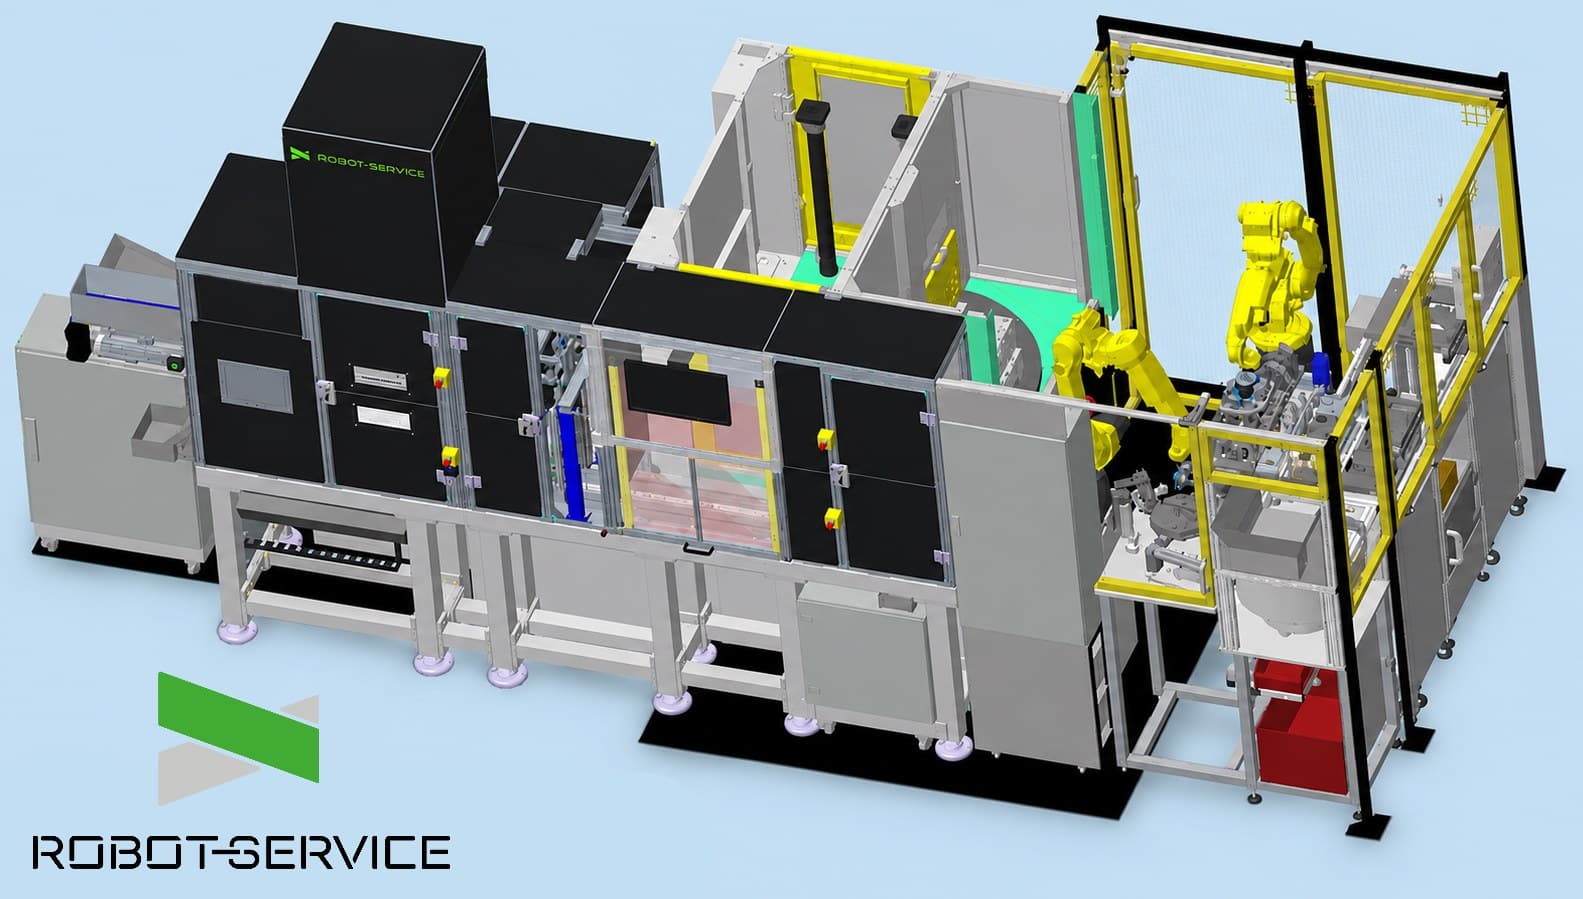
In the initial situation, an operator manually ground a part and then carried out its visual quality inspection, working in a three-shift pattern. The aim of the project was to fully automate this process. In the robotic solution, the robot picked the parts from a raw-material infeed unit and then machined them on the same grinding machine that the operator had used previously. After machining, the robot positioned the workpiece at a camera inspection point; based on the inspection carried out there, good products were placed in a designated container, while defective parts went into a scrap bin.
In addition to the robot, the system included the safety fence, the control cabinet, the HMI and the camera performing the quality inspection.
At the start of the project, the life cycle of the manufactured product was estimated at 5–7 years; production eventually ended in 2024. The total cost of the investment was EUR 95,000. The annual maintenance cost of the automation was initially estimated at EUR 1,500, but the actual measured value averaged EUR 2,300 a year – this amount applied to the entire cell, not only to the automated elements. It is important to note that the operating company already had the technical knowledge and infrastructure required to handle automated solutions, so the cost of technician staff did not represent an additional burden.
The annual wage cost of the operator position replaced by the automation was EUR 14,000 in 2018, and because of the three-shift system the automated cell replaced the work of three operators each year. At the planning stage, the payback period of the investment was calculated using the following formula:
Payback period (years) = [Investment + (maintenance cost * 5)] / Annual benefit = [EUR 95,000 + (5 * EUR 1,500)] / (EUR 14,000 * 3) = EUR 102,500 / EUR 42,000 = 2.4 years
The planned ROI at the end of year 5 was as follows:
(Benefit − Investment) / Investment * 100 = {[(EUR 14,000 * 3) * 5] − [EUR 95,000 + (5 * EUR 1,500)]} / [EUR 95,000 + (5 * EUR 1,500)] * 100 = 51.19%
The actual results of the project, however, turned out even more favourable, because production ran not for 5 but for 6 years, and wages rose significantly in the meantime. At the company, wages increased by an average of 6% a year, so an employee who earned EUR 14,000 in 2018 had reached an annual income of EUR 19,860 by 2024. Over the entire period, this corresponds to an average wage cost of EUR 16,788 per year per operator.
We therefore calculated the actual ROI as follows:
(Benefit − Investment) / Investment * 100 = {[(EUR 16,788 * 3) * 6] − [EUR 95,000 + (6 * EUR 2,300)]} / [EUR 95,000 + (6 * EUR 2,300)] * 100 = 177.7%
The case study clearly shows that even a relatively simple automation project can deliver a significant economic benefit. Compared with the initial conservative estimates, reality turned out more favourably, primarily owing to the rapid rise in wage costs and the longer operating period. The project not only paid for itself but generated a benefit of almost twice the investment, confirming the claim that automation is not merely a cost-cutting tool but also a strategic investment.
Outlook: level of automation and economic performance – an international comparison
One of the most widely used measures of industrial automation is robot density, which shows how many industrial robots there are per ten thousand employees in the industrial sector. This indicator not only gives a picture of the level of technological development, but increasingly also functions as an indicator of economic significance – since it indirectly points to productivity, labour efficiency and national economic competitiveness.
South Korea leads the global ranking with more than 1,000 robots per 10,000 industrial workers, followed by Singapore (~730 robots), Japan and Germany (~400–430 robots), and China (~470 robots), which has developed spectacularly in recent years. With close to 295 robots, the United States is also among the leaders, while the European average is around 200 robots per 10,000 workers. By contrast, robot density in Hungary is currently estimated at around 100 robots, which still lags behind the international front-runners but shows a clearly rising trend.
This difference in the level of robotisation clearly indicates that countries with a higher degree of automation typically have higher industrial productivity and GDP value creation. Robots do not increase GDP by themselves, but they enable faster, more accurate production with less manual labour input – which means lower unit costs, a lower defect rate and greater flexibility.
International examples show that there is a close, positive correlation between industrial robotisation and economic performance. The examples of South Korea, Germany and China confirm that investment in robots pays off in the longer term as a competitive advantage, especially in industries where high-volume, stable production allows the technology to be exploited to the full.
For Hungary this carries a twofold message: on the one hand, because of the lower level of automation there is still considerable growth potential; on the other hand, competitive advantage can be based less and less on cheap labour. Rising wage costs and the shortage of skilled labour increasingly call for technological responses, among which robotisation and industrial automation play a key role.
Summary
Industrial automation is not merely a technological upgrade – it is a strategic economic decision that can determine a company's competitiveness in the long term. In order to give a well-founded answer to the question of when and what is worth automating, the manufacturing processes, the tasks that can be automated, and the cost and resource structure must first be mapped precisely.
Robot-Service Kft. helps its partners ensure that automation is not only a technological investment, but one that pays off and is sustainable. We identify where automation is worthwhile, support the decision with return calculations, and then accompany you through every step of implementation – from concept development through execution and training to long-term operation.